

A strategy implemented by one of SuPra’s underlying managers capitalizes on the difference between the volatility of individual, or ‘single-name’ stocks, and that of a broader index. The first leg of the strategy, the ‘index leg,’ involves taking a short position on the volatility of the index. The second leg of the strategy, the ‘single-name leg,’ involves taking a long position on the volatility of individual stocks in the index. The nuance lies in the correlation between the equities involved in the single-name leg. If the correlation between the individual equities is negative, then the single-name equities will tend to move in different directions, offsetting each other and keeping volatility relatively lower at the index level. However, if the equities involved in the single-name leg are highly correlated, the individual equities amplify each other’s movements, resulting in more volatility at the index level. By carefully analyzing equity correlation and selecting the right variance positions, the strategy benefits more from the long positions on the individual equity volatility than it falls from the short positions on index volatility.
The merits of volatility focused strategies are apparent when considering recent market developments. As fear of potentially excessive AI-related capital expenditures by hyperscalers mounts, investors have begun rotating out of the crowded technology exposures into other sectors. At the same time, anxiety about AI disrupting business models in certain areas (e.g. software and logistics) is colliding with still-robust US earnings growth. The result is a pronounced increase in equity dispersion, where volatility at the individual equity level has been elevated while that of indexes remained relatively subdued (as a sell-off in one sector is being matched by a rally in another sector). According to a Financial Times article, Citadel Securities has described the gap between single-stock and index volatility as being at its highest level since the Global Financial Crisis, underscoring the turbulence within individual names beneath an otherwise calm index surface (see below; ‘Factor Volatility’ represents average single-name volatility across a broad range of factor baskets).
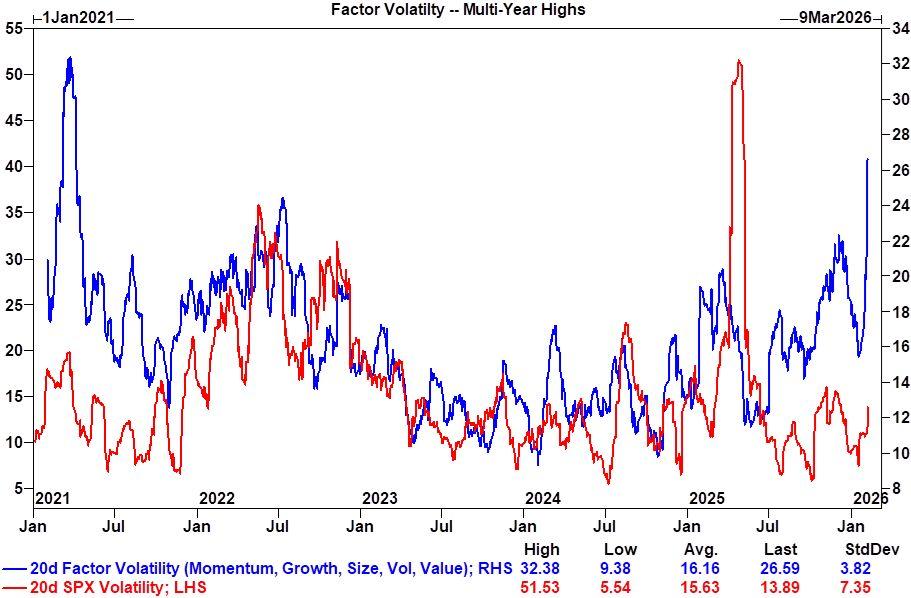
Chart: Goldman Research